LLDB is your friend
This article was originally posted by me (in pt_br) on EquinociOS, a collection of articles made by CocoaHeads Brazil.
Introduction
LLDB is an extensive subject, books have been written about it, but the idea of this post is to give some tips of how I’ve been using LLDB during my career and some practical examples to help your workflow. For a detailed LLDB study I’d start with the project’s website
What is LLDB?
LLDB is the default debugger that comes with every new version of Xcode. It was created to replace the old GDB and one of the coolest things is that it uses LLVM for expression parse, something really useful we’ll see in a moment.
On the project’s website you can see that LLDB supports C/C++, RenderScript and Objective-C, but the version that comes with Xcode can be found on Apple’s Github page. You can check that by running the command language and see that swift is also in there. You can also compare the runtime comment headers for Swift and Objective-C
:)
(lldb) language
     Commands specific to a source language.

Syntax: language <language-name> <subcommand> [<subcommand-options>]

The following subcommands are supported:

      cplusplus    -- Commands for operating on the C++ language runtime.
      objc         -- Commands for operating on the Objective-C language
                      runtime.
      renderscript -- Commands for operating on the RenderScript runtime.
      swift        -- A set of commands for operating on the Swift Language
                      Runtime.

For more help on any particular subcommand, type 'help <command> <subcommand>'.
Just a simple test
How many times have you changed your code just for a “simple test”? Simple things where you want to know the value of a variable and end up doing something like this:
print("WTF? \(whatIsThis)")
Or, you had to force a condition to test a specific flow and did something like this:
if myCondition || true {
    //do stuff
}
We’re not even considering that every time you need to recompile, run the app, wait for the simulator or device and then do the steps to reach the place you want to test, and only then, see the result. To do this once or twice it’s not the end of the world, but if you start to take into account every single time you do this, there’s a considerable amount of time being thrown away.
But what’s the worst issue here? Changing your code!
This type of code change is highly problematic, it’s way too easy to forget a change you did and end up sending it to production. Even things that looks harmless like a print or NSLog could became a gigantic source of headaches like using it to log private/sensitive information and ship it to the app store.
OK, changing code is bad, but what’s the alternative for the “simple test”? Breakpoints!
Breakpoints
A breakpoint is nothing but a way to stop the app execution while giving you the ability to control the code execution of your app. To add a breakpoint you just need to click on the line you wish to stop the execution.
When you do this, what happens behind the scenes is something like this:
breakpoint set --file ViewController.swift --line 30
You can actually run this command on the LLDB CLI and the breakpoint will be created, the difference being that if you do this the breakpoint will not be saved between different run sessions, while if you do it using Xcode it will save it until you decide to remove it. Important to note that there’s a direct relation with what you do on Xcode’s UI and the LLDB commands.
At the moment your app executes the line that has a breakpoint set, the LLDB CLI will be visible at the bottom part of Xcode.
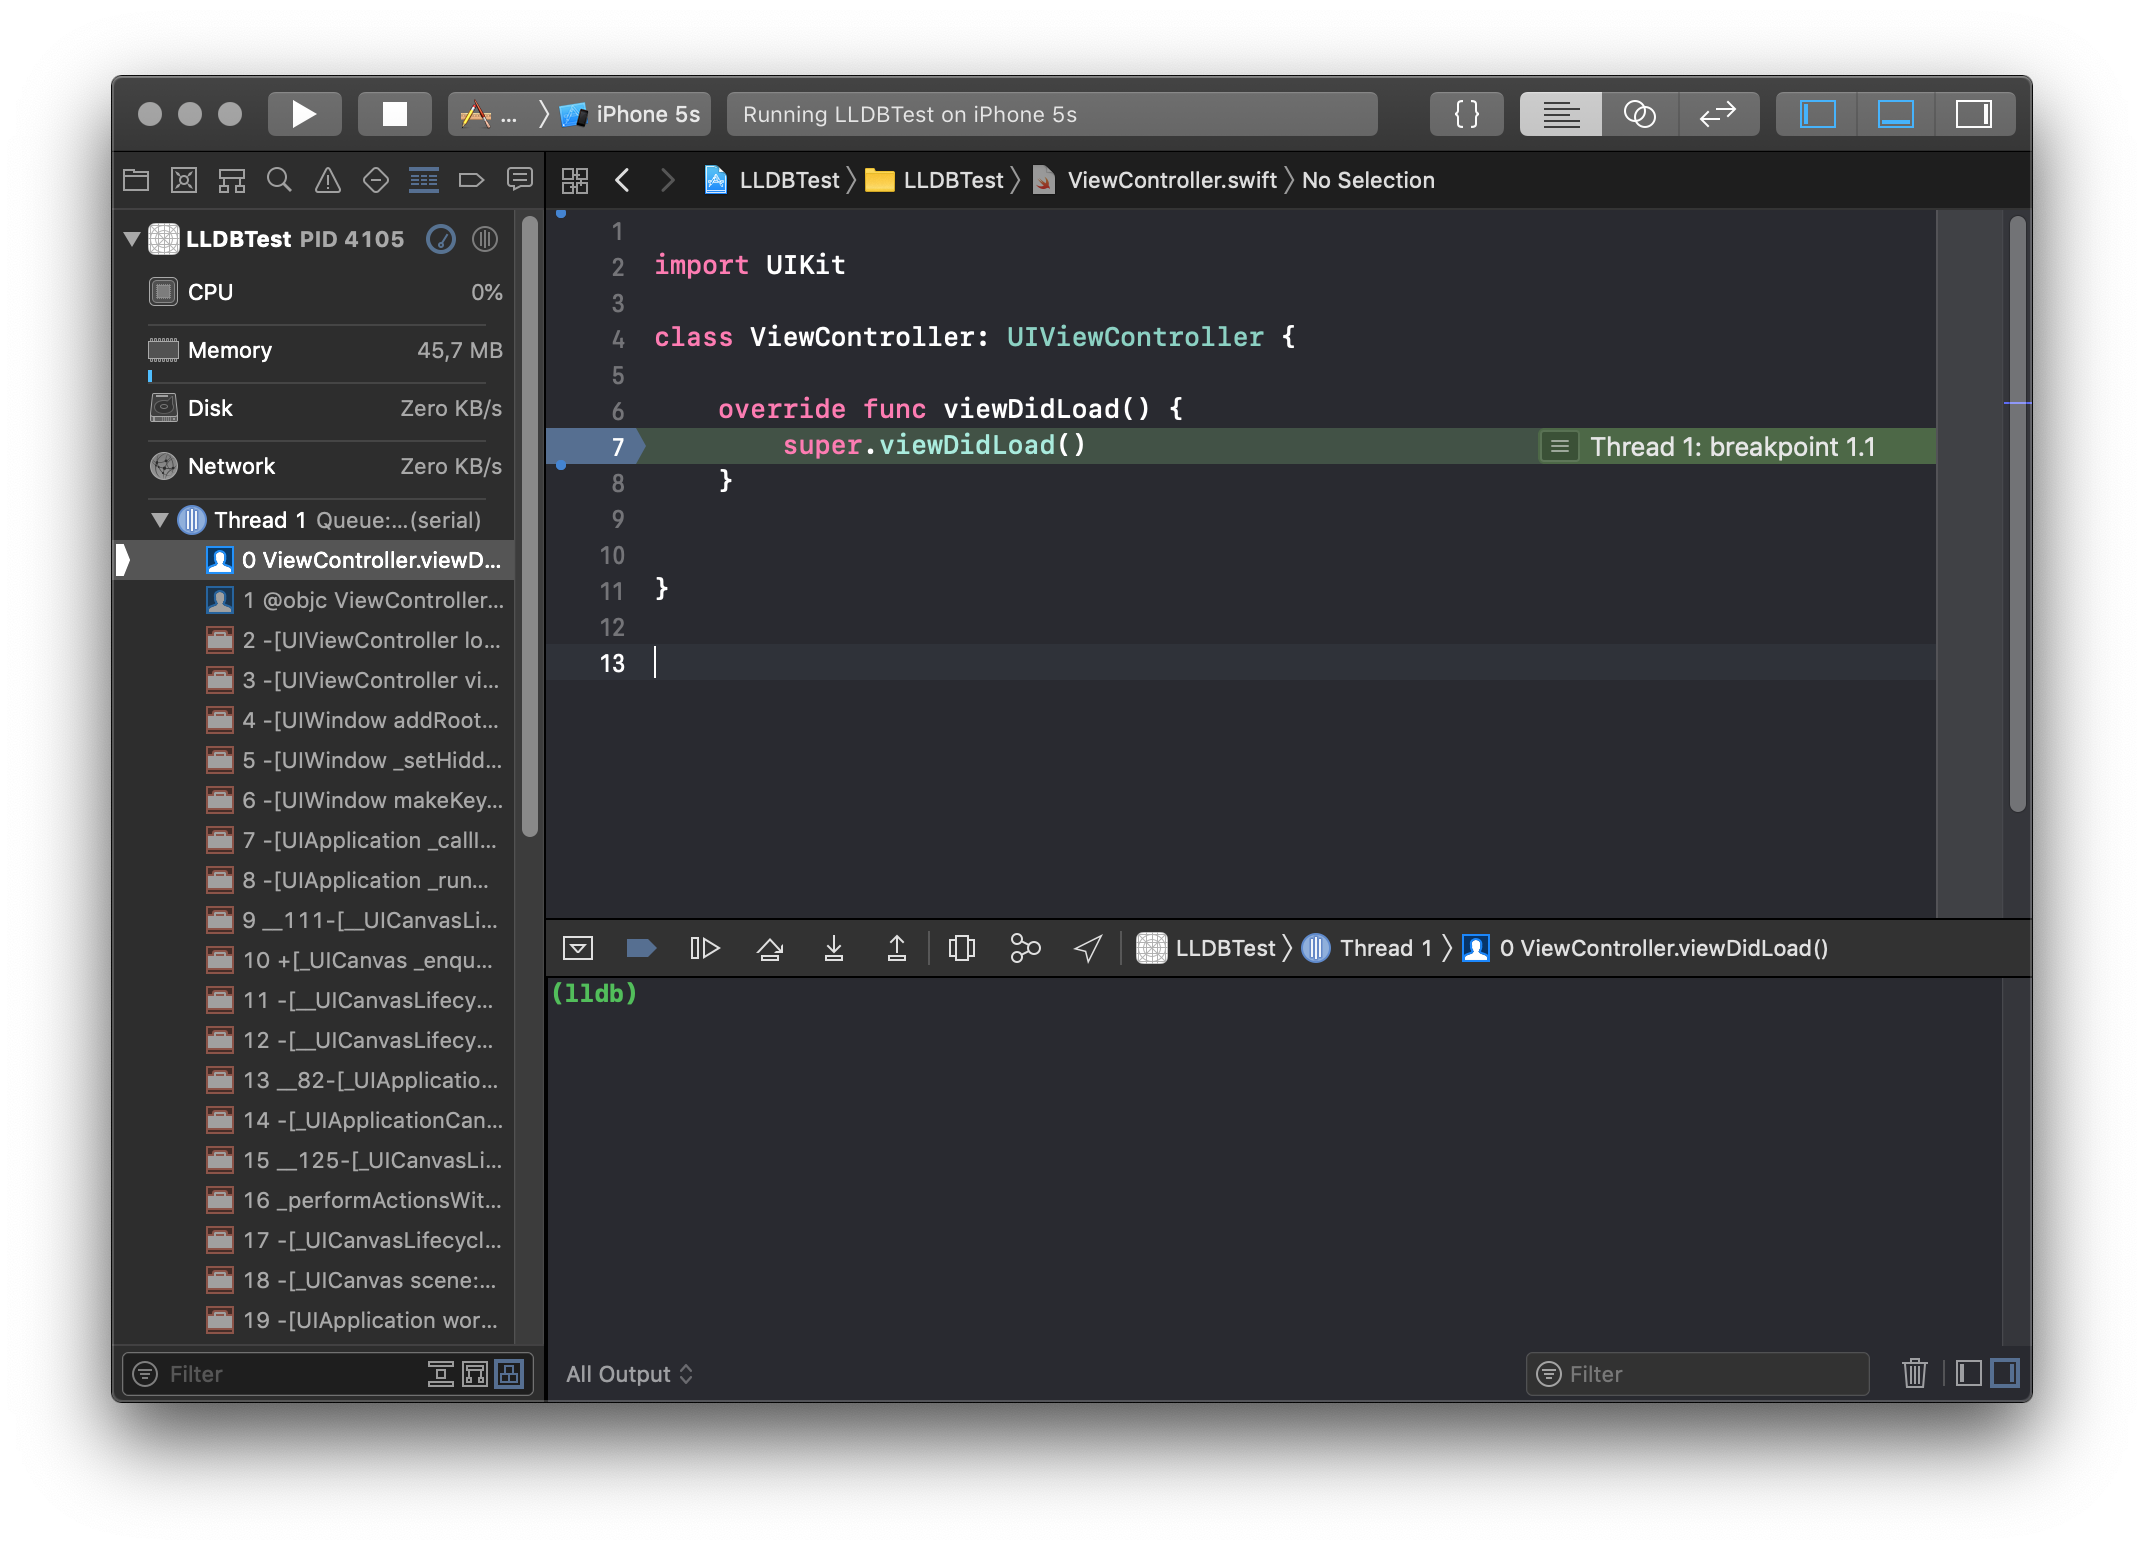
On the console header you can notice some buttons that will help you to control the application flow, from the left to the right we have:
- Hide debug area: Toggles the CLI view;
- Deactivate breakpoints: Toggles all breakpoints without removing them;
- Continue: Continue the app execution;
- Step Over: Executes the current line of code and stops on the next one;
- Step Into: Steps into the code call stack (i.e: Goes inside a method);
- Step Out: Steps out the current code stack and moves you back to the caller;
Commands
All Xcode commands that talks with LLDB always have a CLI counterpart, for example, the buttons we just saw: Continue, Step Over, Step Into and Step Out could also be executed by writing: continue, step, stepi e finish.
OK, your app is stopped at your breakpoint, you can now go step by step and investigate what’s going on, but it would be super nice to have ways to interact with your data and execution flow. To do that we have some LLDB commands that might help you, here’s a simple list of some of them:
- Expression (e):
(lldb) help expression
   Evaluate an expression on the current thread.  Displays any returned value
   with LLDB's default formatting.  Expects 'raw' input (see 'help
   raw-input'.)
In other words, it will basically run (evaluate) any expression you type. The expression could be exactly like any line of code you’d write on Xcode (that are some exceptions that could make LLDB to not understand the expression, but almost always there’s a workaround to achieve what you want). Even better, with expression you can change your values at runtime, because of this it’s important to keep in mind that running an expression has side effects to your execution. This is so important that there’s a lot of other commands that are basically just an alias for expression with some parameters.
- Frame (fr):
(lldb) help frame
   Commands for selecting and examing the current thread's stack frames.
Frame will allow you to inspect the current stack frame, the important thing to know about it is that frame will not have side effects to your runtime.
- Print (p):
(lldb) help print
   Evaluate an expression on the current thread.  Displays any returned value
   with LLDB's default formatting.  Expects 'raw' input (see 'help
   raw-input'.)
   ...
   ...
'print' is an abbreviation for 'expression --'
This is just an alias to
expression, which means it could have side effects on your app, just have this in mind while using it. - Print Object (po):
(lldb) help po
   Evaluate an expression on the current thread.  Displays any returned value
   with formatting controlled by the type's author.  Expects 'raw' input (see
   'help raw-input'.)
...
...
'po' is an abbreviation for 'expression -O  --'
Just like
printpois just an alias forexpressionbut with the-Oparameter. The difference here is that running apowill output the result ofdebugDescription. It’s calledPrint Objectbecause that was the name used on GBD - Watchpoint (w):
Watchpoint is used to “follow” the value of an object. Let’s say you want to know when a variable changed values, you can use
watchpointfor that.
To know more about LLDB commands you can just type help on the CLI. This site also has a nice list comparing the GDB commands to LLDB;
Worth to note that LLDB does a prefix matching, meaning that you can just type e instead of expression, etc.
Printing
Let’s say you want to know the value of a var named counter, instead of changing your code to add a print(counter) you could just add a breakpoint in a place that makes sense to you and then on the LLDB CLI just type:
(lldb) p counter
(Int) $R0 = 0
Now you can see your value 0 without changing a single line of your code. Let’s try the same thing for an UILabel to get it’s text value:
(lldb) p label
(UILabel) $R10 = 0x00007fed5740aba0 {
  UIKit.UIView = {
    baseUIResponder@0 = {
      NSObject = {
        isa = 0x00007fed5740aba0
      }
    }
    _constraintsExceptingSubviewAutoresizingConstraints = nil
    _cachedTraitCollection = nil
    _animationInfo = nil
    .....
    .....
This result doesn’t look very useful if our goal was to know the value of a label. This is happening because p or expression is printing the built in formatters on the Label. To solve that we could use po to print it’s debugDescription and get something different:
(lldb) po label
<UILabel: 0x7fb311e05be0; frame = (100 100; 200 200); text = 'Square'; userInteractionEnabled = NO; layer = <_UILabelLayer: 0x60000191e260>>
Or we could just p directly on the label.text property like so:
(lldb) p label.text
(String?) $R22 = "Square"
To better understand this, what do you think would happen if we use the same po on self which in this case is an UIViewController ?
(lldb) po self
<LLDBTest.ViewController: 0x7fb311e05880>
What’s happening here? Why it didn’t display any useful information to us? This is happening because po is trying to print the debugDescription (or a fallback to description) of our ViewController but it’s not finding anything to return. Let’s change this:
override var debugDescription: String {
     return "This is a debug description and my counter is \(counter)"
}
And when we run po again:
(lldb) po self
This is a debug description and my counter is 0
This could be really useful when you have a custom object and want to output some special information during debugging.
Watching
Consider the situation where you have a variable that’s being changed but it wasn’t supposed to. You don’t know why or when the value is being changed. One solution would be to find every place in your project that sets that variable, but that’s sounds like a lot of work. Another option would be to override it’s setter and set a breakpoint inside, but at this point we’re changing our code to debug, something we want to avoid.
There’s a better solution: watchpoint and it’s very straightforward.
(lldb) watchpoint set variable self.counter
Watchpoint created: Watchpoint 1: addr = 0x7fb4ef4068b0 size = 8 state = enabled type = w
    declare @ '~/LLDBTest/ViewController.swift:27'
    watchpoint spec = 'self.counter'
The next time your counter changes, Xcode will stop on the correct frame, open the CLI, and you’ll be able to see what’s going on just by inspecting it’s backtrace
Watchpoint 1 hit:
(lldb) bt
* thread #1, queue = 'com.apple.main-thread', stop reason = watchpoint 1
* frame #0: 0x0000000109bd26f9 LLDBTest`ViewController.counter.setter(value=1, self=0x00007fa28250ab70) at ViewController.swift:0
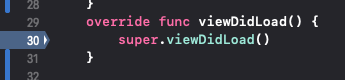
frame #1: 0x0000000109bd2b9a LLDBTest`ViewController.viewDidLoad(self=0x00007fa28250ab70) at ViewController.swift:30
frame #2: 0x0000000109bd2bd4 LLDBTest`@objc ViewController.viewDidLoad() at <compiler-generated>:0
This is actually something that works better using Obj-C, where the watchpoint besides stopping at the correct frame, it automatically gives you the old and new value:
Watchpoint 1 hit:
old value: 0
new value: 1
To list all your watchpoints use the command list:
(lldb) watchpoint list
Number of supported hardware watchpoints: 4
Current watchpoints:
Watchpoint 1: addr = 0x7f962ec09590 size = 8 state = enabled type = w
    declare @ '~/LLDBTest/ViewController.swift:27'
    watchpoint spec = 'self.counter'
And to remove a watchpoint you can use the command delete.
In our case, our watchpoint is the Watchpoint 1 so we use:
(lldb) watchpoint delete 1
1 watchpoints deleted.
Interacting
We just saw how to inspect your code variables and application flow, but what about situations where you want to actually interact with the execution of your app? Change variables, create another, etc, how to do all that without changing your code and compiling it again?
Imagine a situation where you have a counter and want to test a case where the value is 100, but this is incremented one by one by a tap of a button. You could go to your code and change the value to 100, but then you are changing your code and if you forget it, it will be really bad. Not a good solution.
Using expression you can do all that, let’s see some quick examples:
(lldb) p counter
(Int) $R0 = 0
(lldb) e counter = 100
(lldb) p counter
(Int) $R4 = 100
Here we started with our counter set to 0, then executed the expression which changed it to 100.
Another situation is changing some colors, let’s say you want to try some different combinations but you don’t want to compile/run your code every time.
(lldb) e view.backgroundColor = .blue
That’s it, now your view’s background color will be set to blue, making it easier to play around with some styles.
You might have noticed that the background color only changed after you continued with the execution because it was “stuck” on your breakpoint. One way to force the view to change without having to leave your breakpoint is to force a flush like so:
(lldb) e CATransaction.flush()
Another cool thing to do with expression is to create new variables or even new views on your hierarchy:
(lldb) e UILabel(frame: CGRect(x: 100, y: 100, width: 200, height: 200))
(UILabel) $R8 = 0x00007ffe8aa0b230 {
  UIKit.UIView = {
       ....
       ....
With this you just created a new UIView directly from the LLDB CLI, and if you have noticed when you use expression where something returns a value, you see a register number like $R8 in our previous example. This is your reference to the return value of the previous command, in this case a UIView, and by using it we can now add it to our view and change it’s color like so:
(lldb) e view.addSubview($R8)
(lldb) e $R8.backgroundColor = .blue
(lldb) e CATransaction.flush()
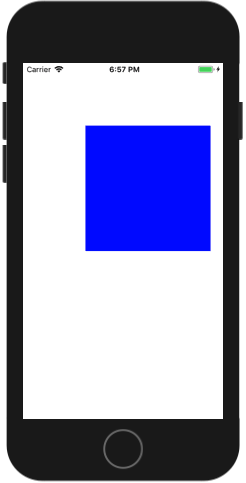
With that you can now see a blue square on your simulator without having to ever leave the breakpoint.
Another cool thing I like to do is to use LLDB to simulate memory warning. You might think “You can just use the simulator menu to do that”, fair enough, but what about real devices? When you have a real device connected to debug your application there’s no way to do it, that’s when we can use LLDB + ObjC runtime to do this:
Let’s assume we have this code:
override func didReceiveMemoryWarning() {
     print("memory warning received")
}
(lldb) expression -l objc -O -- [[UIApplication sharedApplication] performSelector:@selector(_performMemoryWarning)]
memory warning received
0x80f6273d0a500012
And you can see that my didReceiveMemoryWarning was called as expected.
Breakpoint Actions
Now we know how to use some LLDB commands to help you debug your application and even change the runtime flow without changing a single line of code, but would be really good if there was a way to save these actions so there’s no need to keep writing them all the time. Imagine you always want to know the value of some x variable, would be really tedious to keep stopping the app’s execution and writing p all the time. To solve this we have breakpoint actions.
To access a breakpoint action just double click on your breakpoint or use Command + Alt + click.
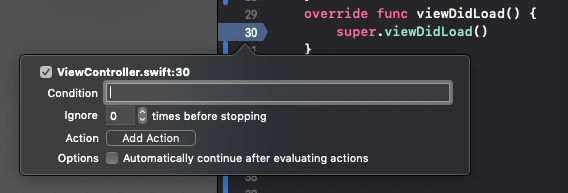
Here you can define some parameters like:
- Condition: When you want to add a condition to your breakpoint, for example, during a parser you want to activate the breakpoint only if the variable
Xhas value equals toY; - Ignore: When you want to ignore the breakpoint X number of times, for example, in a loop;
- Action: Here you select the action for your breakpoint, we will take a look in more details next;
- Options: Just an option to continue in case you don’t want your breakpoint to stop the app’s execution.
Actions
On the breakpoint panel, when you click on actions you’ll see a list with multiple options which will run once your breakpoint is called.
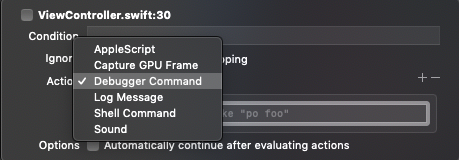
- Apple Script: Executes an Apple Script every time this breakpoint is called. You could do something like sending an email or slack message while this runs on a CI.
- Capture GPU Frame: In case you’re running something with Metal.
- Debugger Command: All commands we saw before could be used here, this is one of the actions I use the most.
- Log Message: Simple way to log something on your console.
- Shell Command: Similar to the Apple Script action, but for shell.
- Sound: Plays a sound. Could be useful in situations you have concurrency and want to be notified when something happens.
Worth to note that you can chain a lot of actions on the same breakpoint. For example, log a message and a sound after some condition.
Auto Login
Let’s use the breakpoint actions to solve a problem I believe everyone had at one point: Login. Every time you run the app you have to waste precious moments of your life to:
- Type the username;
- Type the password;
- Tap the login button;
It might sound like a small thing to worry about, but doing this every time you run your app, multiple times per day, you can see how this will slow you down. How to solve this? Well, we could just add this to our code:
loginTextField.text = "email@email.com"
passwordTextField.text = "superSecurePassword"
No! Não! Nee! Niet! Nein! Imagine if something like this goes to production? All your users will see a hardcoded user/pass on your login screen because you forgot to remove this before sending to the app store.
To solve this problem we can create a breakpoint with two debugger command actions and add the expressions:
e loginTextField.text = "email@email.com"
e passwordTextField.text = "superSecurePassword"
Done! We don’t have to worry about sending hardcoded passwords to production and we also don’t have to waste time writing the same thing multiple times a day. But we can improve this, let’s also make the app to login without having to wait for us to tap on the login button. Just add another debugger command with the call to your login method like so:
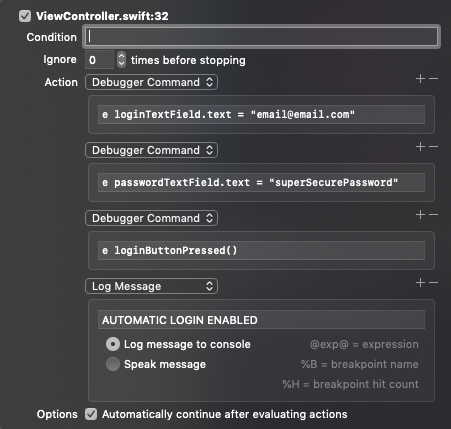
I have also added a Log Message to make it clear what’s going on when looking at the console.
The next time your breakpoint is called it will fill your username, password text fields, automatically login and write AUTOMATIC LOGIN ENABLED on your console. If you don’t want to automatically login for some reason you can just click on the brakpoint to disable it without deleting your actions.
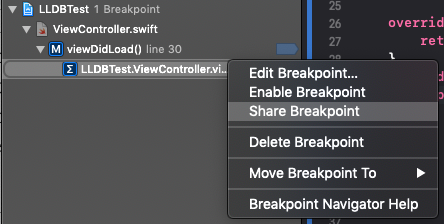
Sharing
Another cool thing you can do with breakpoints is to share them on your project. One good application of this is when you submit a new bug on Apple’s Bug Reporter. You could create the sample project, add the breakpoints that call all the methods that triggers the issue.
Another situation is to just have some standard breakpoint actions shared with your team, just be mindful that when you do that the breakpoint information is saved in plain text on your xcshareddata, you’ll not want to add any sensitive information in a shared breakpoint.
To share a breakpoint you just need to open your breakpoint navigator (⌘ + 8), right click on your breakpoint and select “Share”.
LLDB plugins
It is possible to write Python LLDB plugins, which allow us to use excellent plugins like Chisel.
Chisel is nothing but a collection of new commands for you to use on LLDB. After installing Chisel you can check them out by writing help on LLDB CLI. Everything under Current user-defined commands was added when you installed Chisel (or any other plugin you might have).
Current user-defined commands:
  alamborder    -- Put a border around views with an ambiguous layout
  alamunborder  -- Removes the border around views with an ambiguous layout
  bdisable      -- Disable a set of breakpoints for a regular expression
  ...
  ...
Here are some Chisel commands I use regularly:
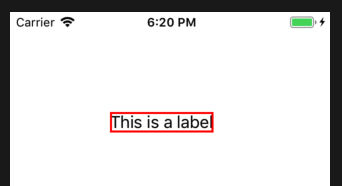
border
Draws a border around view or layer. Color and width can be optionally provided. Additionally depth can be provided in order to recursively border subviews.
(lldb) border label
mwarning
Remember when I wrote about how to simulate memory warning?
(lldb) expression -l objc -O -- [[UIApplication sharedApplication] performSelector:@selector(_performMemoryWarning)]
With Chisel all you need to do is:
(lldb) mwarning
memory warning received
visualize
Open a UIImage, CGImageRef, UIView, or CALayer in Preview.app on your Mac.
(lldb) visualize label
psjson
Print JSON representation of Swift Dictionary or Swift Array
let dictionary = ["name": "John",
                  "email": "john@john.com"]
(lldb) psjson dictionary
{
  "name" : "John",
  "email" : "john@john.com"
}
Conclusion
It’s easy to see the importance that LLDB can have in our workflow, consider the amount of “Build & Run” you can avoid, the security of changing the flow of your app without having to change the code and forget to change it later. As I mentioned earlier, these are just some of the things you can do with LLDB, this post has no intention of being an extensive manual of how to use LLDB and list all the things it can do, but just some tips and tricks of how I like to use it on my workflow.
I hope that the next time you think about changing your code just to do a “simple test”, when you think about compiling your code and going all the way to the affected part you want to test, that you remember what you read here, don’t forget, LLDB is your friend 😊